Archive for the ‘information ecosystem’ Category

Today in The Hill: Science is littered with zombie studies. Here’s how to stop their spread.

November 26th, 2023

My newest piece is in The Hill today: Science is littered with zombie studies. Here’s how to stop their spread.

Many people think of science as complete and objective. But the truth is, science continues to evolve and is full of mistakes. Since 1980, more than 40,000 scientific publications have been retracted. They either contained errors, were based on outdated knowledge or were outright frauds. 

Identifying these inaccuracies is how science is supposed to work. …Yet these zombie publications continue to be cited and used, unwittingly, to support new arguments. 

Why? Almost always it’s because nobody noticed they had been retracted. 

Science is littered with zombie studies. Here’s how to stop their spread. Jodi Schneider in The Hill

Thanks to The OpEd Project, the Illinois’ Public Voices Fellowship, and my coach Luis Carrasco. Editorial writing is part of my NSF CAREER: Using Network Analysis to Assess Confidence in Research Synthesis. The Alfred P. Sloan Foundation funds my retraction research in Reducing the Inadvertent Spread of Retracted Science including the NISO Communication of Retractions, Removals, and Expressions of Concern (CREC) Working Group.

Tags: , , ,
Posted in information ecosystem, scholarly communication | Comments (0)

Last call for public comments: NISO RP-45-202X, Communication of Retractions, Removals, and Expressions of Concern

November 26th, 2023

I’m pleased that the draft Recommended Practice, NISO RP-45-202X, Communication of Retractions, Removals, and Expressions of Concern (CREC) is open for public comment through December 2, 2023. I’m a member of the NISO Working Group which is funded in part by the Alfred P. Sloan Foundation in collaboration with my Reducing the Inadvertent Spread of Retracted Science project.

The NISO CREC Recommended Practice will address the dissemination of retraction information (metadata & display) to support a consistent, timely transmission of that information to the reader (machine or human), directly or through citing publications, addressing requirements both of the retracted publication and of the retraction notice or expression of concern. It will not address the questions of what a retraction is or why an object is retracted.

NISO CREC

Tags: , , , , ,
Posted in future of publishing, information ecosystem, Information Quality Lab news, library and information science, scholarly communication | Comments (0)

What can two-way communication between scientists and citizens enable?

September 24th, 2023

The Washington Post quoted NIH researcher Paul Hwang: “Amazing findings in medicine are sometimes based on one patient”.

The findings here are a breakthrough discovery in a disease called ME/CFS – commonly known as chronic fatigue syndrome or myalgic encephalomyelitis – which led to a recent PNAS paper. This is an amazing moment: Without biomarkers, it’s been a contested disease “you have to fight to get”.

What really strikes me, though, is the individual interactions that created a space for knowledge production: an email from one citizen (Amanda Twinam) to one scientist (Paul Hwang); “serendipitous correspondence” from another scientist (Brian Walitt) with access to “an entire population” (9 of the 14 tested for the PNAS paper were similar to Amanda). Reading the literature, writing well-timed correspondence, and “hearing about” synergistic work going on in another lab all seem to have contributed.

Mady Hornig, a researcher not involved in the project, told the reporter: “It’s not very common that we do all of these … steps, having doctors who are really persistent about what is happening with one individual and applying a scientific lens.”

But what if we did?


Dumit, Joseph (2006). Illnesses you have to fight to get: Facts as forces in uncertain, emergent illnesses. Social Science & Medicine, 62(3), 577–590. https://doi.org/10.1016/j.socscimed.2005.06.018

Wang, Ping-yuan, Ma, Jin, Kim, Young-Chae, Son, Annie Y., Syed, Abu Mohammad, Liu, Chengyu, Mori, Mateus P., Huffstutler, Rebecca D., Stolinski, JoEllyn L., Talagala, S. Lalith, Kang, Ju-Gyeong, Walitt, Brian T., Nath, Avindra, & Hwang, Paul M. (2023). WASF3 disrupts mitochondrial respiration and may mediate exercise intolerance in myalgic encephalomyelitis/chronic fatigue syndrome. Proceedings of the National Academy of Sciences, 120(34), e2302738120. https://doi.org/10.1073/pnas.2302738120

Vastag, Brian (2023, September 19). She wrote to a scientist about her fatigue. It inspired a breakthrough. Washington Post. https://www.washingtonpost.com/health/2023/09/17/fatigue-cfs-longcovid-mitochondria/ Temporarily open to read via this gift link.

Tags: , , , ,
Posted in information ecosystem, random thoughts, scholarly communication | Comments (0)

Knowledge Graphs: An Aggregation of Definitions

March 3rd, 2019

I am not aware of a consensus definition of knowledge graph. I’ve been discussing this for awhile with Liliana Giusti Serra, and the topic came up again with my fellow organizers of the knowledge graph session at US2TS as we prepare for a panel.

I’ve proposed the following main features:

  • RDF-compatible, has a defined schema (usually an OWL ontology)
  • items are linked internally
  • may be a private enterprise dataset (e.g. not necessarily openly available for external linking) or publicly available
  • covers one or more domains

Below are some quotes.

I’d be curious to hear of other definitions, especially if you think there’s a consensus definition I’m just not aware of.

“A knowledge graph consists of a set of interconnected typed entities and their attributes.”
Jose Manuel Gomez-Perez, Jeff Z. Pan, Guido Vetere and Honghan Wu. “Enterprise Knowledge Graph: An Introduction.”  In Exploiting Linked Data and Knowledge Graphs in Large Organisations. Springer. Part of the whole book: http://link.springer.com/10.1007/978-3-319-45654-6

“A knowledge graph is a structured dataset that is compatible with the RDF data model and has an (OWL) ontology as its schema. A knowledge graph is not necessarily linked to external knowledge graphs; however, entities in the knowledge graph usually have type information, defined in its ontology, which is useful for providing contextual information about such entities. Knowledge graphs are expected to be reliable, of high quality, of high accessibility and providing end user oriented information services.”

Boris Villazon-Terrazas, Nuria Garcia-Santa, Yuan Ren, Alessandro Faraotti, Honghan Wu, Yuting Zhao, Guido Vetere and Jeff Z. Pan .  “Knowledge graphs: Foundations”. In Exploiting Linked Data and Knowledge Graphs in Large Organisations.  Springer. Part of the whole book: http://link.springer.com/10.1007/978-3-319-45654-6


“The term Knowledge Graph was coined by Google in 2012, referring to their use of semantic knowledge in Web Search (“Things, not strings”), and is recently also used to refer to Semantic Web knowledge bases such as DBpedia or YAGO. From a broader perspective, any graph-based representation of some knowledge could be considered a knowledge graph (this would include any kind of RDF dataset, as well as description logic ontologies). However, there is no common definition about what a knowledge graph is and what it is not. Instead of attempting a formal definition of what a knowledge graph is, we restrict ourselves to a minimum set of characteristics of knowledge graphs, which we use to tell knowledge graphs from other collections of knowledge which we would not consider as knowledge graphs. A knowledge graph

  1. mainly describes real world entities and their interrelations, organized in a graph.

  2. defines possible classes and relations of entities in a schema.

  3. allows for potentially interrelating arbitrary entities with each other.

  4. covers various topical domains.”

Paulheim, H. (2017). Knowledge graph refinement: A survey of approaches and evaluation methods. Semantic web8(3), 489-508.

“ISI’s Center on Knowledge Graphs research group combines artificial intelligence, the semantic web, and database integration techniques to solve complex information integration problems. We leverage general research techniques across information-intensive disciplines, including medical informatics, geospatial data integration and the social Web.”

Just as I was “finalizing” my list to send to colleagues, I found a poster all about definitions:
Ehrlinger, L., & Wöß, W. (2016). Towards a Definition of Knowledge Graphs. SEMANTiCS (Posters, Demos, SuCCESS)48http://ceur-ws.org/Vol-1695/paper4.pdf
Its Table 1: Selected definitions of knowledge graph has the following definitions (for citations see that paper)

“A knowledge graph (i) mainly describes real world entities and their interrelations, organized in a graph, (ii) defines possible classes and relations of entities in a schema, (iii) allows for potentially interrelating arbitrary entities with each other and (iv) covers various topical domains.” Paulheim [16]

“Knowledge graphs are large networks of entities, their semantic types, properties, and relationships between entities.” Journal of Web Semantics [12]

“Knowledge graphs could be envisaged as a network of all kind things which are relevant to a specific domain or to an organization. They are not limited to abstract concepts and relations but can also contain instances of things like documents and datasets.” Semantic Web Company [3]

“We define a Knowledge Graph as an RDF graph. An RDF graph consists of a set of RDF triples where each RDF triple (s, p, o) is an ordered set of the following RDF terms: a subjects∈U∪B,apredicatep∈U,andanobjectU∪B∪L. AnRDFtermiseithera URI u ∈ U, a blank node b ∈ B, or a literal l ∈ L.” Färber et al. [7]

“[…] systems exist, […], which use a variety of techniques to extract new knowledge, in the form of facts, from the web. These facts are interrelated, and hence, recently this extracted knowledge has been referred to as a knowledge graph.” Pujara et al. [17]


“A knowledge graph is a graph that models semantic knowledge, where each node is a real-world concept, and each edge represents a relationship between two concepts”

Fang, Y., Kuan, K., Lin, J., Tan, C., & Chandrasekhar, V. (2017). Object detection meets knowledge graphs.
https://oar.a-star.edu.sg/jspui/handle/123456789/2147


“things not strings” – Google

Tags: , ,
Posted in information ecosystem, semantic web | Comments (0)

QOTD: Doing more requires thinking less

December 1st, 2018

by the aid of symbolism, we can make transitions in reasoning almost mechanically by the eye which would otherwise call into play the higher faculties of the brain.

…Civilization advances by extending the number of important operations that we can perform without thinking about them. Operations of thought are like cavalry charges in a battle — they are strictly limited in number, they require fresh horses, and must only be made at decisive moments.

One very important property for symbolism to possess is that it should be concise, so as to be visible at one glance of the eye and be rapidly written.

– Whitehead, A.N. (1911). An introduction to mathematics, Chapter 5, “The Symbolism of Mathematics” (page 61 in this version)
HT to Santiago Nuñez-Corrales (Illinois page for Santiago Nuñez-Corrales, LinkedIn for Santiago Núñez-Corrales) who used part of this quote in a Conceptual Foundations Group talk, Nov 29.

From my point of view, this is why memorizing multiplication tables is not now irrelevant; why new words for concepts are important; and underlies a lot of scientific advancement.

Tags: , , ,
Posted in information ecosystem, random thoughts | Comments (0)

QOTD: Working out scientific insights on paper, Lavoisier case study

July 12th, 2017

…language does do much of our thinking for us, even in the sciences, and rather than being an unfortunate contamination, its influence has been productive historically, helping individual thinkers generate concepts and theories that can then be put to the test. The case made here for the constitutive power of figures [of speech] per se supports the general point made by F.L. Holmes in a lecture addressed to the History of Science Society in 1987. A distinguished historian of medicine and chemistry, Holmes based his study of Antoine Lavoisier on the French chemist’s laboratory notebooks. He later examined drafts of Lavoisier’s published papers and discovered that Lavoisier wrote many versions of his papers and in the course of careful revisions gradually worked out the positions he eventually made public (Holmes, 221). Holmes, whose goal as a historian is to reconstruct the careful pathways and fine structure of scientific insights, concluded from his study of Lavoisier’s drafts

We cannot always tell whether a thought that led him to modify a passage, recast an argument, or develop an alternative interpretation occurred while he was still engaged in writing what he subsequently altered, or immediately afterward, or after some interval during which he occupied himself with something else; but the timing is, I believe, less significant than the fact that the new developments were consequences of the effort to express ideas and marshall supporting information on paper (225).

– page xi of Rhetorical Figures in Science by Jeanne Fahnestock, Oxford University Press, 1999.

She is quoting Frederich L. Holmes. 1987. Scientific writing and scientific discovery. Isis 78:220-235. DOI:10.1086/354391

As Moore summarizes,

Lavoisier wrote at least six drafts of the paper over a period of at least six months. However, his theory of respiration did not appear until the fifth draft. Clearly, Lavoisier’s writing helped him refine and understand his ideas.

Moore, Randy. Language—A Force that Shapes Science. Journal of College Science Teaching 28.6 (1999): 366. http://www.jstor.org/stable/42990615
(which I quoted in
a review I wrote recently)

Fahnestock adds:
“…Holmes’s general point [is that] there are subtle interactions ‘between writing, thought, and operations in creative scientific activity’ (226).”

Tags: , , , ,
Posted in future of publishing, information ecosystem, scholarly communication | Comments (0)

David Liebovitz: Achieving Care transformation by Infusing Electronic Health Records with Wisdom

May 1st, 2017

Today I am at the Health Data Analytics summit. The title of the keynote talk is Achieving Care transformation by Infusing Electronic Health Records with Wisdom. It’s a delight to hear from a medical informaticist: David M. Liebovitz (publications in Google Scholar), MD, FACP, Chief Medical Information Officer, The University of Chicago. He graduated from University of Illinois in electrical engineering, making this a timely talk as the engineering-focused Carle Illinois College of Medicine gets going.

David Liebovitz started with a discussion of the data problems — problem lists, medication lists, family history, rules, results, notes — which will be familiar to anyone using EHRs or working with EHR data. He draws attention also to the human problems — both in terms of provider “readiness” (e.g. their vision for population-level health) as well as about “current expectations”. (An example of such an expectation is a “main clinician satisfier” he closed with: U Chicago is about to turn on outbound faxing from the EHR!) He mentioned also the importance of resilience.

He mentioned customizing systems as a risk when the vendor makes upstream changes (this is not unique to healthcare but a threat to innovation and experimentation with information systems in other industries.) Still, in managing the EHR, there is continual optimization, scored based on a number of factors. He mentioned:

  • Safety
  • Quality/patient experience
  • Regulatory/legal
  • Financial
  • Usability/productivity
  • Availability of alternative solutions

As well as weighting for old requests.

He emphasized the complexity of healthcare in several ways:
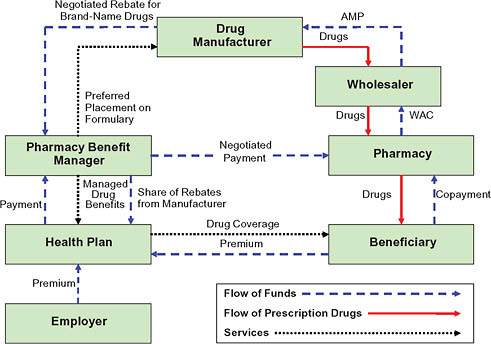
complexity of drug purchasing

An image from “Prices That Are Too High”, Chapter 5, The Healthcare Imperative: Lowering Costs and Improving Outcomes: Workshop Series Summary (2010)

  • Icosystem’s diagram of the complexity of the healthcare system

Complexity of the healthcare system

Icosystem – complexity of the healthcare system

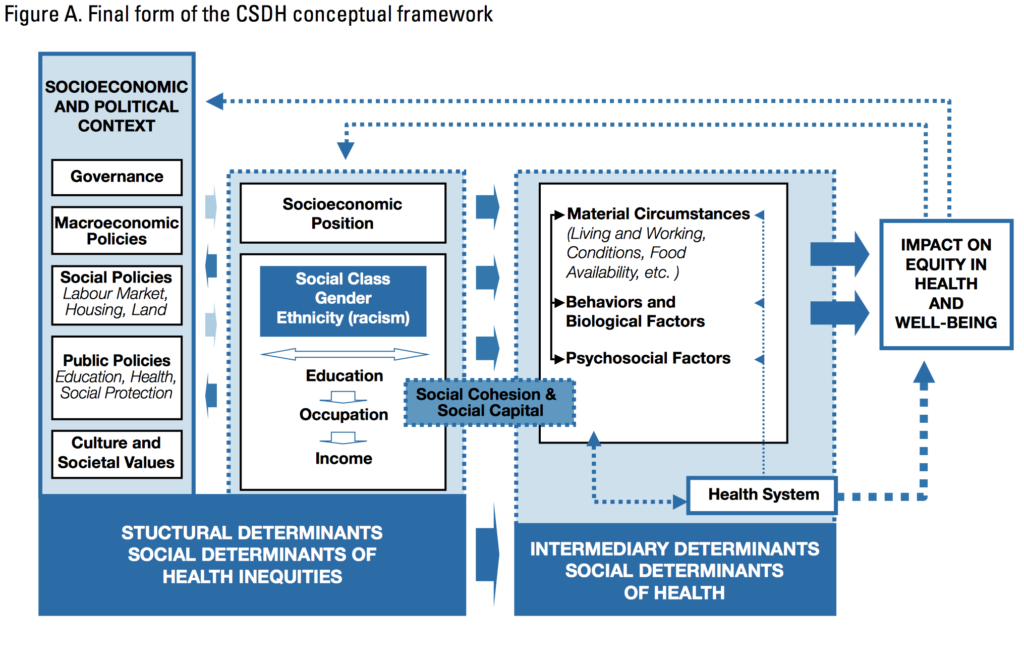
  • Another complexity is the modest impact of medical care compared to other factors
    • such as the impact of socioeconomic and political context on equity in health and well-being (see the WHO image below).
    • For instance, there is a large impact of health behaviors, which “happen in larger social contexts.” (See the Relative Contribution of Multiple Determinants to Health, August 21, 2014, Health Policy Briefs)

Given this complexity, David Liebovitz stresses that we need to start with the right model, “simultaneously improving population health, improving the patient experience of care, and reducing per capita cost”. (See Stiefel M, Nolan K. A Guide to Measuring the Triple Aim: Population Health, Experience of Care, and Per Capita Cost. IHI Innovation Series white paper. Cambridge, Massachusetts: Institute for Healthcare Improvement; 2012).
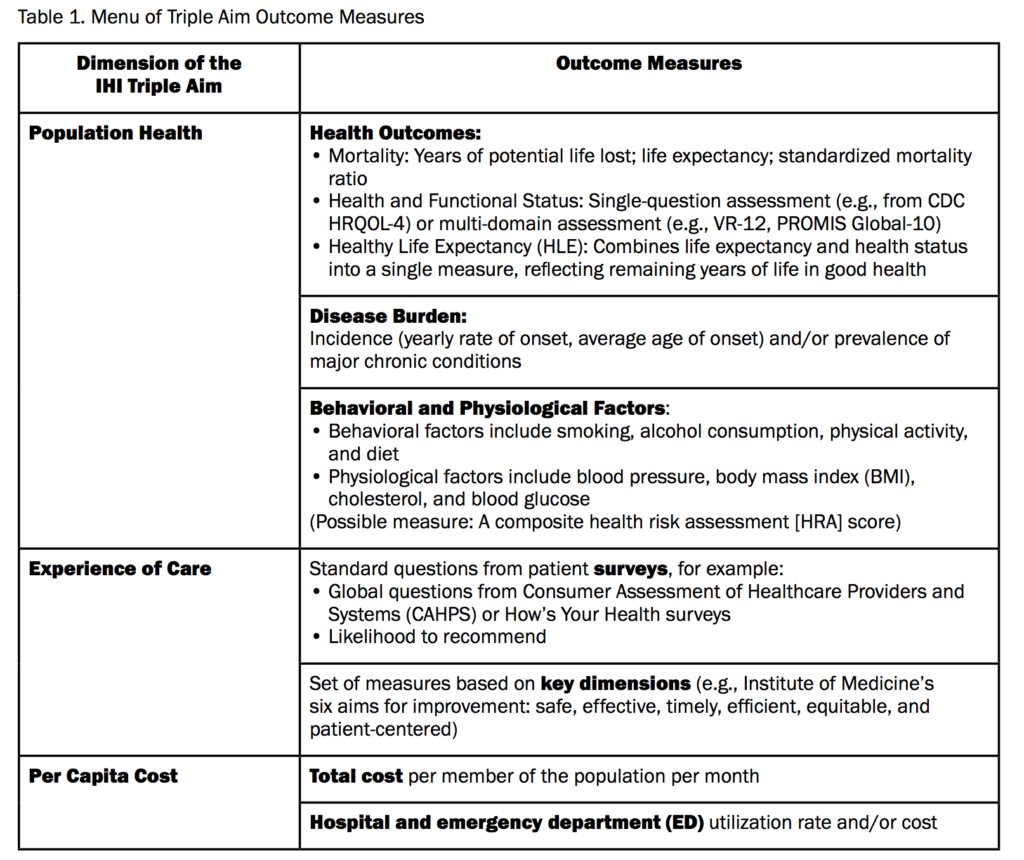
triple aims to measure healthcare improvement

Table 1 from Stiefel M, Nolan K. A Guide to Measuring the Triple Aim: Population Health, Experience of Care, and Per Capita Cost. IHI Innovation Series white paper. Cambridge, Massachusetts: Institute for Healthcare Improvement; 2012.

Given the modest impact of medical care, and of data, he suggests that we should choose the right outcomes.

David Liebovitz says that “not enough attention has been paid to usability”; I completely agree and suggest that information scientists, human factors engineeers, and cognitive ergonomists help mainstream medical informaticists fill this gap. He put up Jakob Nielsen’s 10 usability heuristics for user interface design A vivid example is whether a patient’s resuscitation preferences are shown (which seems to depend on the particular EHR screen): the system doesn’t highlight where we are in the system. For providers, he says user control and freedom are very important. He suggests that there are only a few key tasks. A provider should be able to do ANY of these things wherever they are in the chart:

  • put a note
  • order something
  • send a message

Similarly, EHR should support recognition (“how do I admit a patient again?”) rather than requiring recall.

Meanwhile, on the decision support side he highlights the (well-known) problems around interruptions by saying that speed is everything and changing direction is much easier than stopping. Here he draws on some of his own work, describing what he calls a “diagnostic process aware workflow”
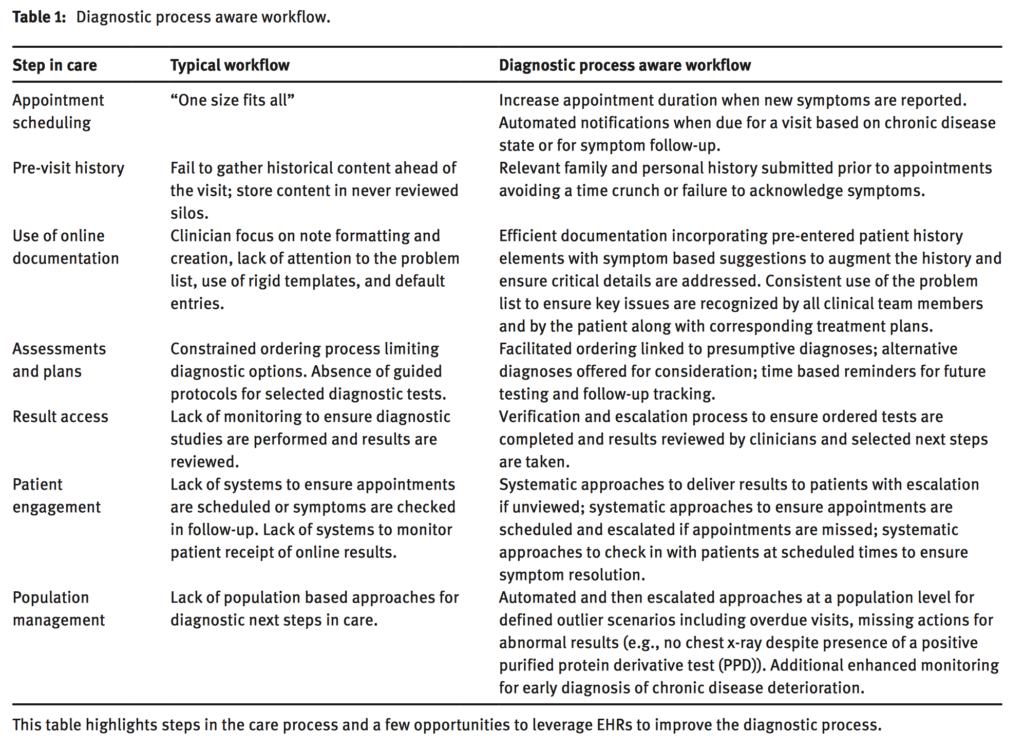
David Liebovitz. Next steps for electronic health records to improve the diagnostic process. Diagnosis 2015 2(2) 111-116. doi:10.1515/dx-2014-0070

Can we predict X better? Yes, he says (for instance pointing to Table 3 of “Can machine-learning improve cardiovascular risk prediction using routine clinical data?” and its machine learning analysis of over 300,000 patients, based on variables chosen from previous guidelines and expert-informed selection–generating further support for aspects such as aloneness, access to resources, socio-economic status). But what’s really needed, he says, is to:

  • Predict the best next medical step, iteratively
  • Predict the best next lifestyle step, iteratively
  • (And what to do about genes and epigenetic measures?)

He shows an image of “All of our planes in the air” from flightaware, drawing the analogy that we want to work on “optimal patient trajectories” — predicting what are the “turbulent events” to avoid”. This is not without challenges. He points to three:

He closes suggesting that we:

  • Finish the basics
  • Address key slices of the spectrum
  • Descriptive/prescriptive
  • Begin the prescriptive journey: impact one trajectory at a time.

Tags: , , ,
Posted in information ecosystem | Comments (0)